Step 2: Graph the data in the table using the graphing function, specifically the scatter plot function.

Assignment 12
By : Olamide Alli
Exploration: Exploring Problems with Microsoft Excel Programming
| Age of Tree | 100s of Board Feet |
| 20 | 1 |
| 40 | 6 |
| 60 | |
| 80 | 33 |
| 100 | 56 |
| 120 | 88 |
| 140 | |
| 160 | 182 |
| 180 | |
| 200 | 320 |
The data above is from the lumber industry, giving the approximate number of board feet of lumber per tree in a forest of a given age. What function will fit the data? Predict the harvest for ages other than those given.
Step 1: Insert the table into an excel spreadsheet
Step 2: Graph the data in the table using the graphing function, specifically the scatter plot function.
Step 3: Construct the best fit line for the scatter plot. I have chosen to use the exponential trend line, the logarithmic trend line, the linear trend line, and the polynomial trend line for the scatter plot.

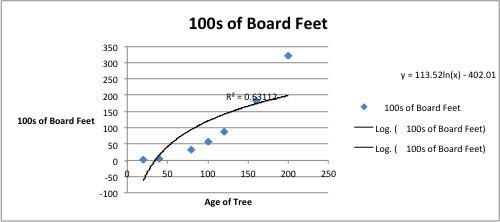

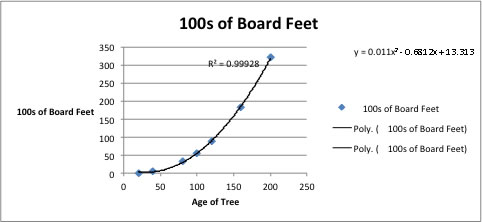
Step 4: Make sure to show the equation of the line as well as the value of R-Squared. R-squared is the correlation coefficient that measures the best fit of a line as well as aids in predicting values of the trend line. The closer R-squared is to 1, the better the fit of the trend line and the more accurate the predicted values will be. From the four graphs above, the polynomial trend line has the R-squared value closet to 1.
Step 5: Record the equation for the polynomial graph and use this as a basis for the next column for your data. You can call this column the Best fit line prediction. Using the values from the “age of tree” column for x, you can now predict the values for the missing slots, better known as the harvest ages, in the original data table!
| Age of Tree | 100s of Board Feet | Best Fit Line Prediction | ||
| 20 | 1 | 4.089 | ||
| 40 | 6 | 3.665 | ||
| 60 | 12.041 | |||
| 80 | 33 | 29.217 | ||
| 100 | 56 | 55.193 | ||
| 120 | 88 | 89.969 | ||
| 140 | 133.545 | |||
| 160 | 182 | 185.921 | ||
| 180 | 247.097 | |||
| 200 | 320 | 317.073 | ||